Designing real-time interactive log streaming for Amazon CloudWatch — the dominant monitoring service used by 89% of AWS customers, processing 1.2 trillion+ API requests per month across 19,000+ companies including JPMorgan Chase, Stripe, Samsung, and EA Sports.
Engineers routinely SSH into multiple servers and run tail -f across terminal sessions to debug errors, validate deployments, and monitor configuration changes. This workflow was fragmented, slow, and required context-switching away from CloudWatch.
Fragmented debugging — Developers routinely SSH into multiple application servers and run tail -f across separate terminal sessions to debug errors, validate deployments, and monitor configuration changes. Each server is a separate context, and there's no way to correlate events across machines in real time.
No cross-service view — Beyond custom application logs, developers needed to tail logs vended by 50+ AWS services — VPC, Route 53, Lambda, EKS, ECS, and more — all flowing into CloudWatch Logs. There was no way to filter or highlight across this diverse set of logs for keywords like ERROR, exception, or application-specific terms in a single unified view.
Third-party dependency — Customers were exporting logs from CloudWatch to third-party monitoring tools like Datadog and Grafana just to get real-time tailing capability — adding cost, latency, and architectural complexity. They were paying twice for the same data and fragmenting their observability stack.
Conducted interviews and observation sessions with developers, SREs, and DevOps engineers across enterprise and startup customers. The format was contextual inquiry — not "what feature do you want," but "show me how you debug an outage today." This revealed the actual terminal-hopping, SSH-based workflow that Live Tail needed to replace.
Studied existing solutions across the spectrum: Linux terminal-based tailing, third-party log streaming tools (Datadog, Grafana, Splunk), and open-source alternatives. The gap was clear — no cloud-native solution offered real-time log streaming inside the console with filtering, highlighting, and drill-down without requiring a separate tool or export pipeline.
Partnered with engineering to understand the CloudWatch Logs streaming architecture — throughput constraints, event display rate limits, and the fundamental challenge of rendering real-time data at a service that processes 5+ petabytes of logs daily. This informed every design tradeoff around what to show, how fast, and what to do when volume exceeds display capacity.
Research revealed that developers weren't just asking for "streaming logs." They had a specific workflow pattern that no tool addressed natively: during an active incident, they needed to watch logs flowing in real time, spot an anomaly, pause to inspect it, then pivot into a deep investigation of surrounding events — all without losing the live stream context or switching tools. The gap wasn't just "no tail -f in the console." It was that debugging required bridging two modes — real-time monitoring and deep investigation — and every existing tool forced a hard switch between them.
Developers don't just want to see logs in real-time — they want to filter, highlight, and drill into specific events without losing the live stream. The design needed to bridge real-time monitoring and deep investigation in a single, continuous flow.
The hardest tradeoff was between completeness and clarity. At 5+ petabytes of logs daily, the system physically cannot display every event in real time during high-volume incidents. We had to decide: hide this constraint and risk eroding trust, or surface it transparently and trust power users to understand? I argued for transparency — which became the "% displayed" indicator, one of the most-praised design decisions in the feature. We also had to balance V1 scope: ship a focused, polished tailing experience first, then expand to Lambda and ECS integration later.
User research, competitive analysis, technical deep dives with engineering. Defined the core use cases and constraints that would shape the design.
Explored filter panel layouts, event stream rendering, and the pause-inspect-resume interaction pattern. Tested with internal SREs to validate the mental model.
Refined the highlighting system, entry point strategy (3 paths into Live Tail), and the "% displayed" transparency indicator. Aligned with PM, engineering, and leadership.
Final usability testing, edge case handling (auto-pause on inactivity, session timeout, restart flow), and integration with the CloudWatch design system for a native console feel.
The Live Tail experience was designed around a single principle: bridge real-time monitoring and deep investigation in one continuous flow. Rather than building a dashboard that passively shows log events, I designed an interactive console where every element — the filter panel, the event stream, the highlighting system, the detail side panel — works together to let developers move fluidly between watching and analyzing without losing context.
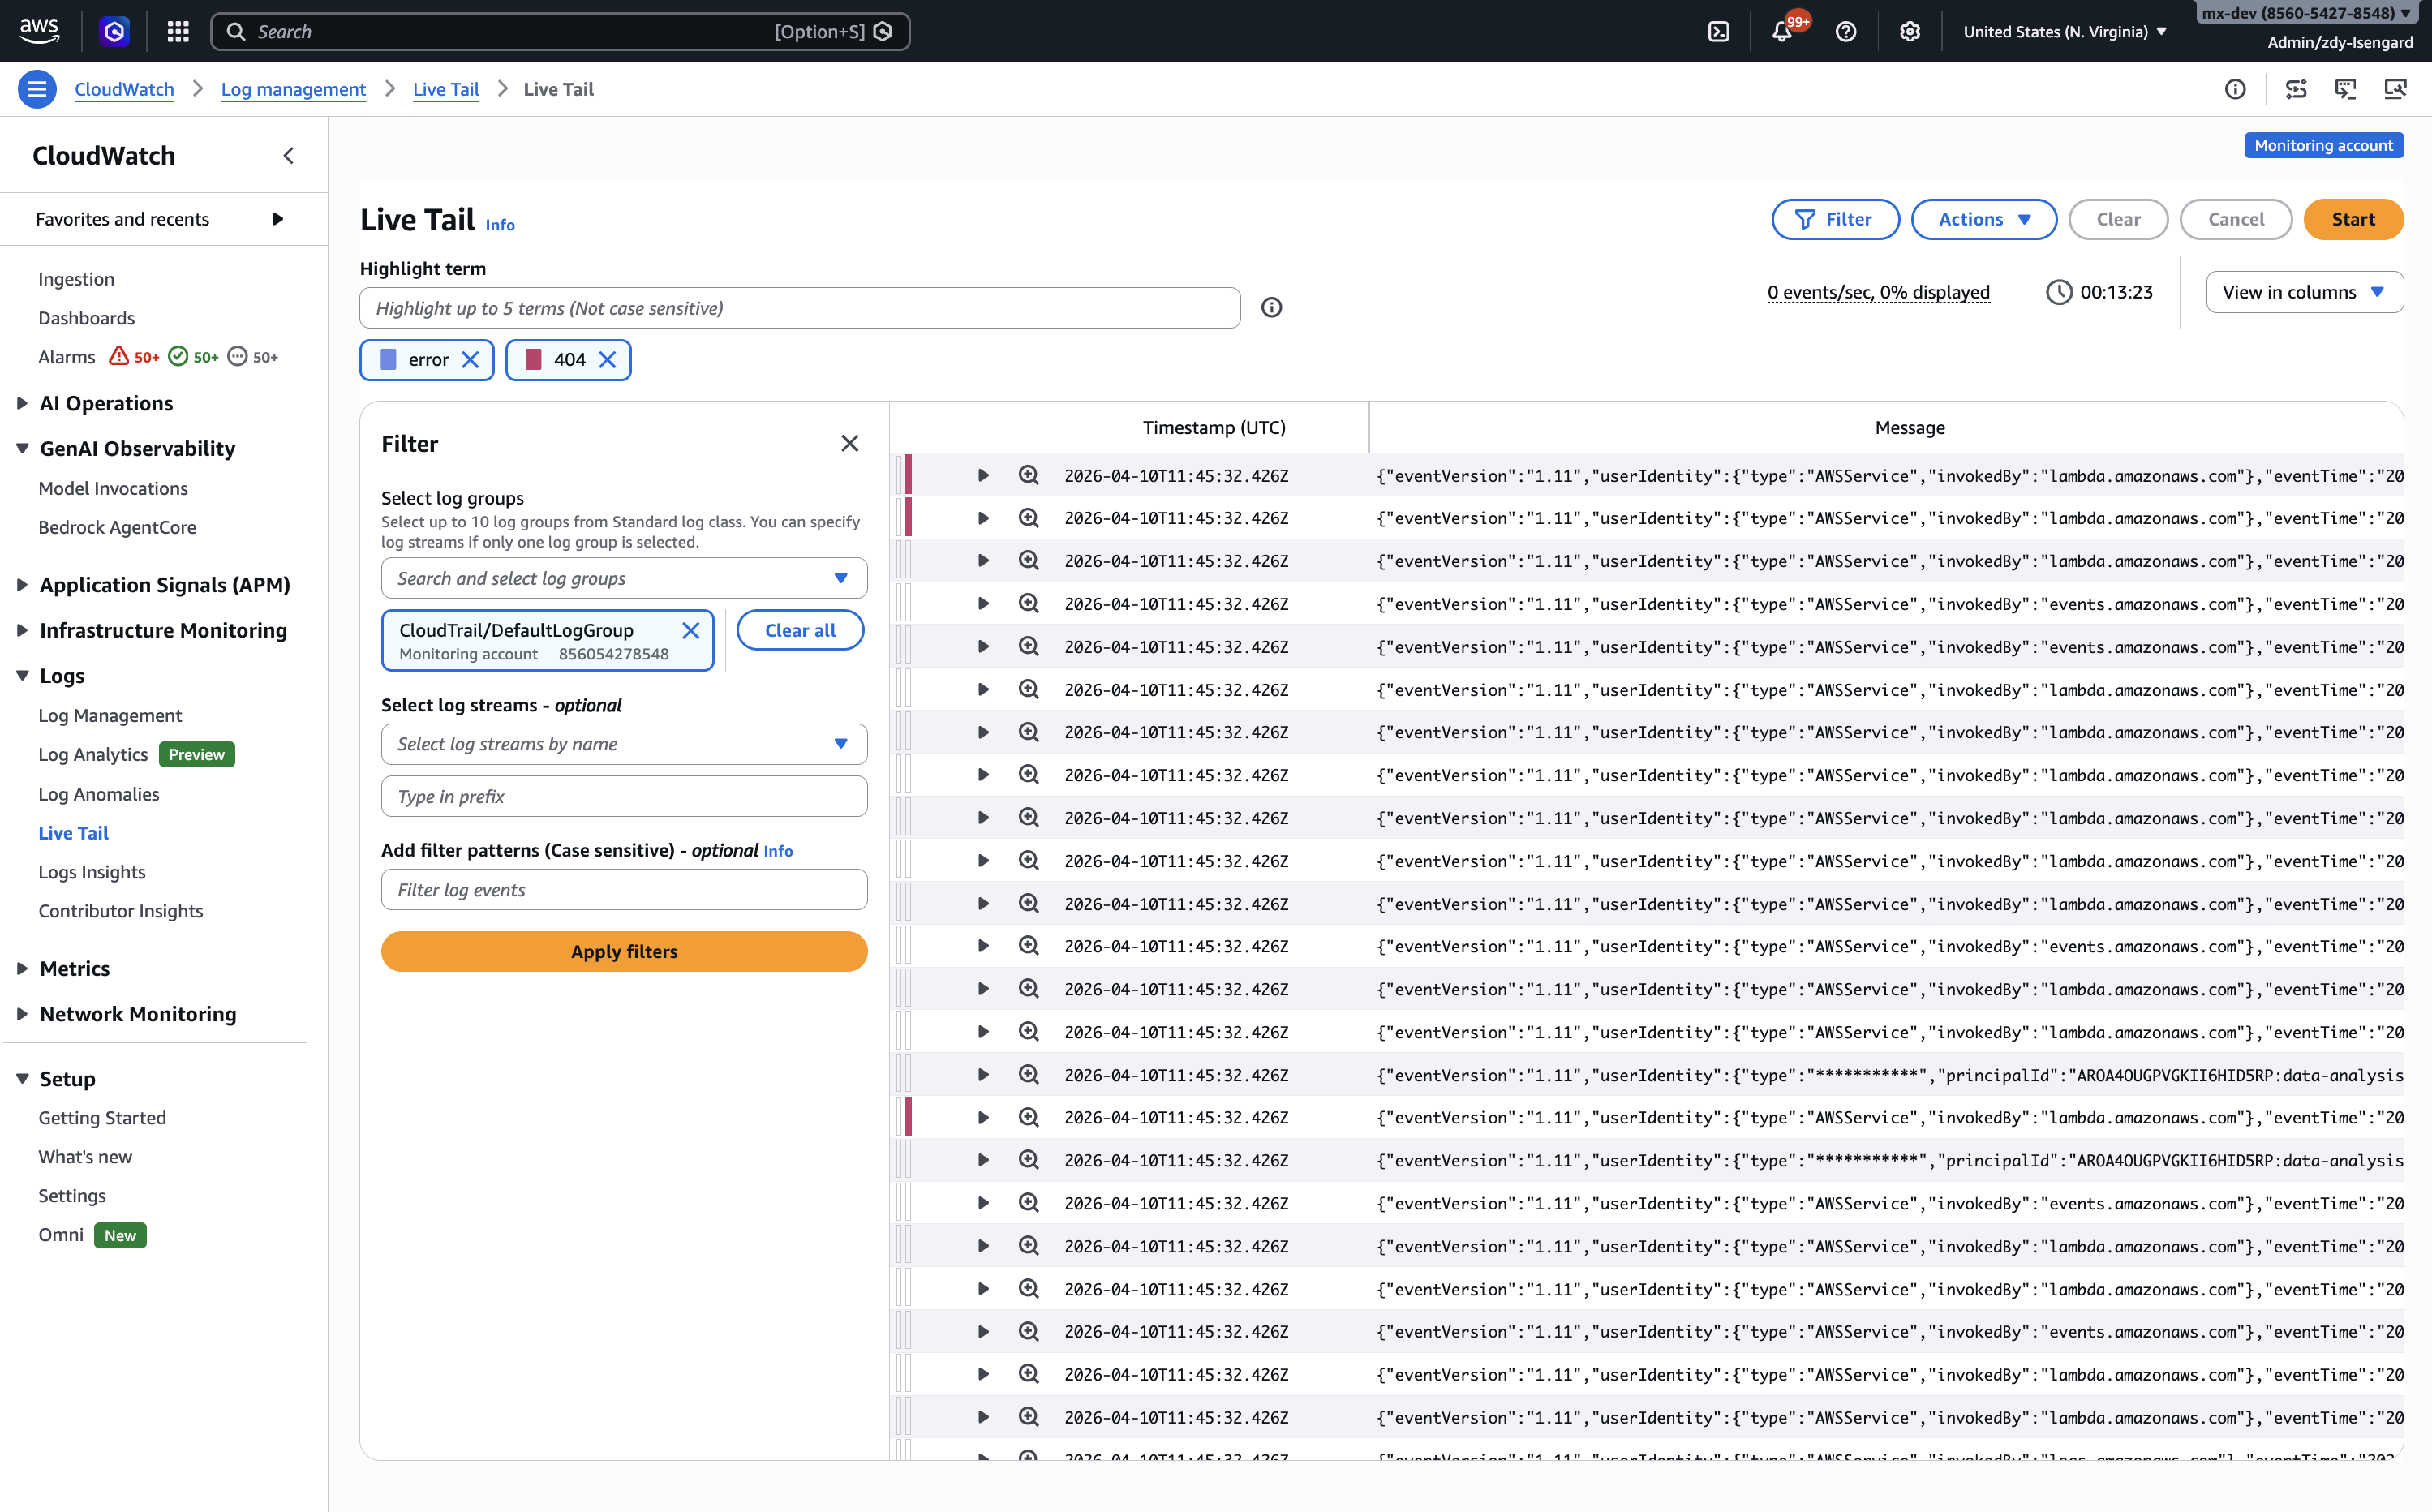
A left-side pop-out filter panel displays a mandatory field for selecting up to 10 log groups — including cross-account sources in CloudWatch cross-account observability setups — plus optional fields for log stream selection and case-sensitive filter patterns. The panel-based approach was chosen over inline controls because power users needed to set complex filters once and then focus entirely on the event stream. The filter pattern field supports matching terms, exact phrases, and numeric values, letting users cut through noise immediately.
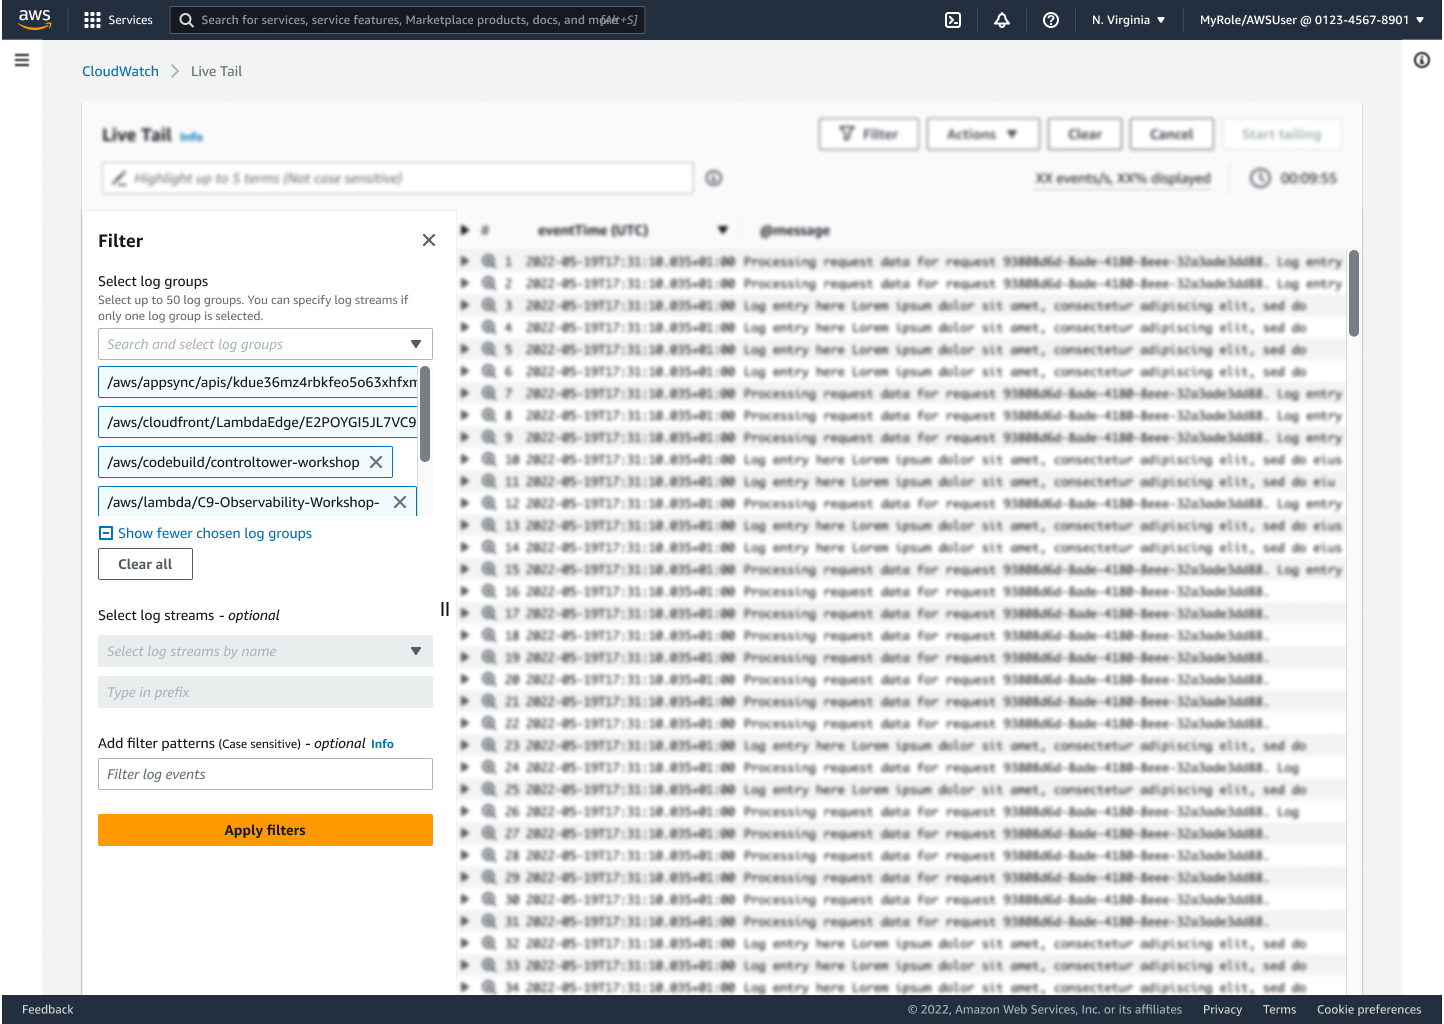
Live Tail console — filter panel with log group selection and pattern matching
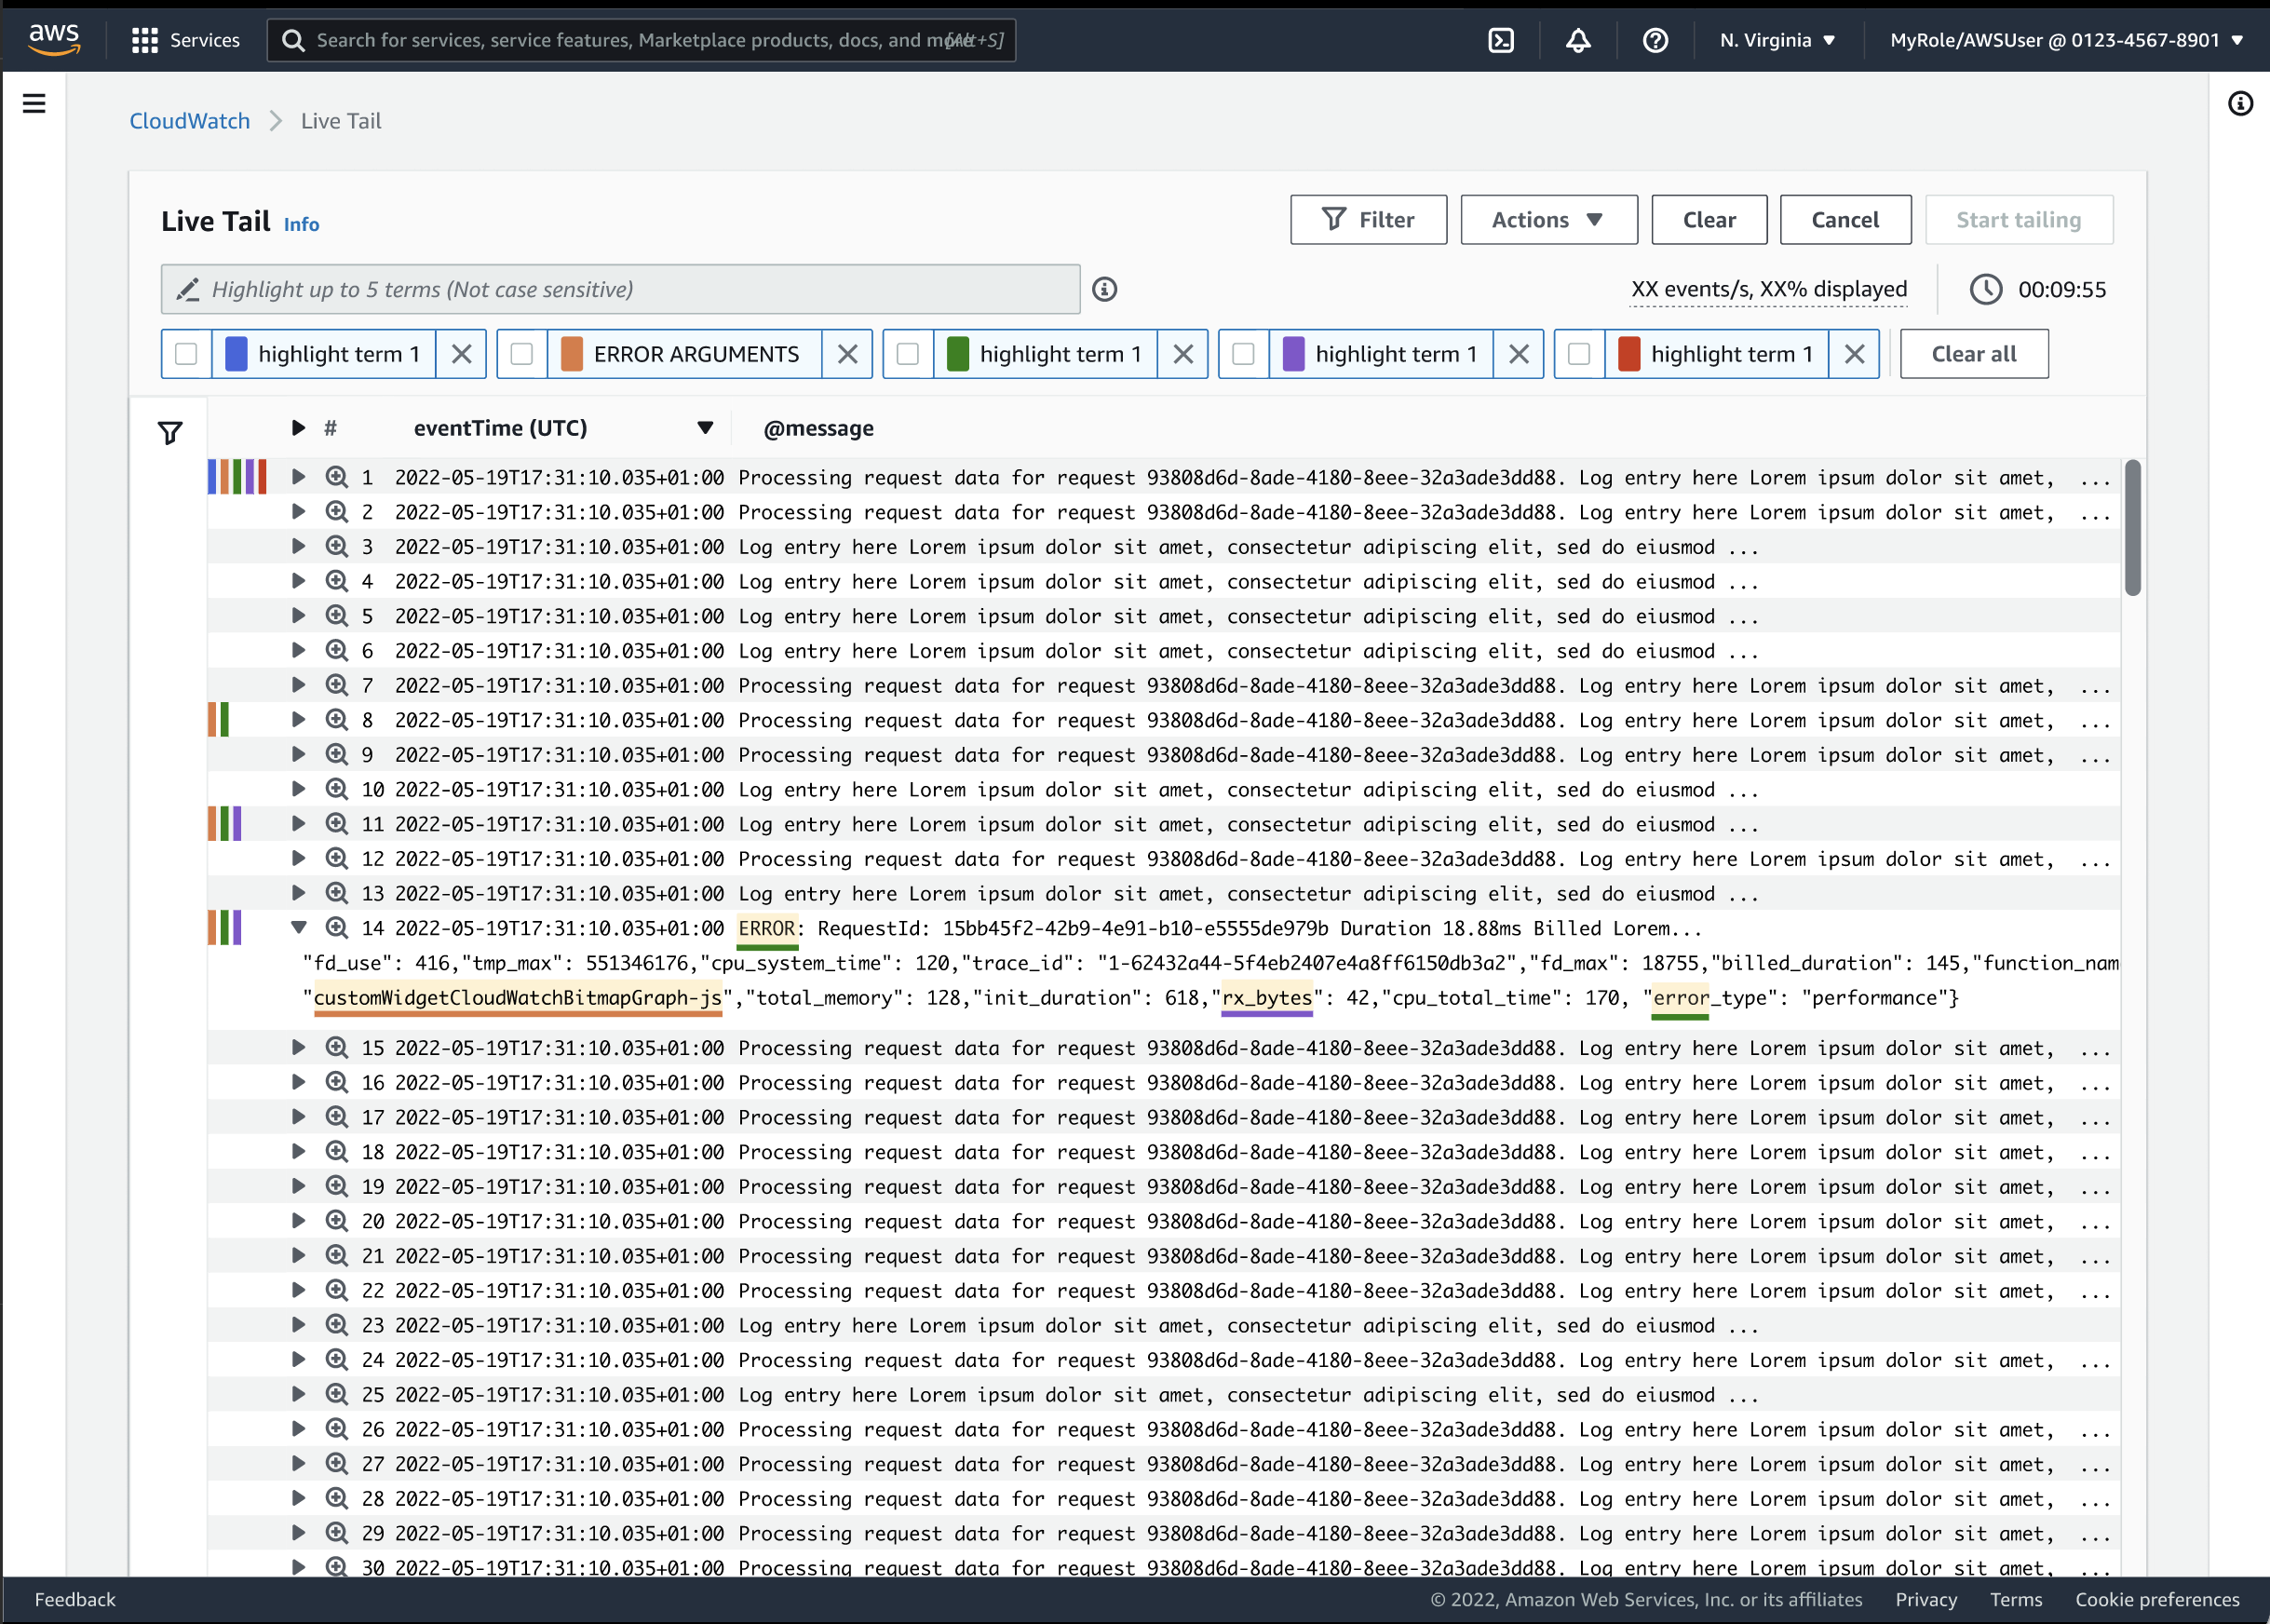
Users can specify up to 5 highlighting terms, each marked with a distinct color-coded indicator on matching events as they stream past. For example: filter on "ERROR" events, then highlight "404" in one color and "timeout" in another to visually categorize error types at a glance. The color system was designed to be instantly scannable — each term gets a persistent indicator bar on the left edge of the event row, so patterns emerge from the visual rhythm even before reading the text.
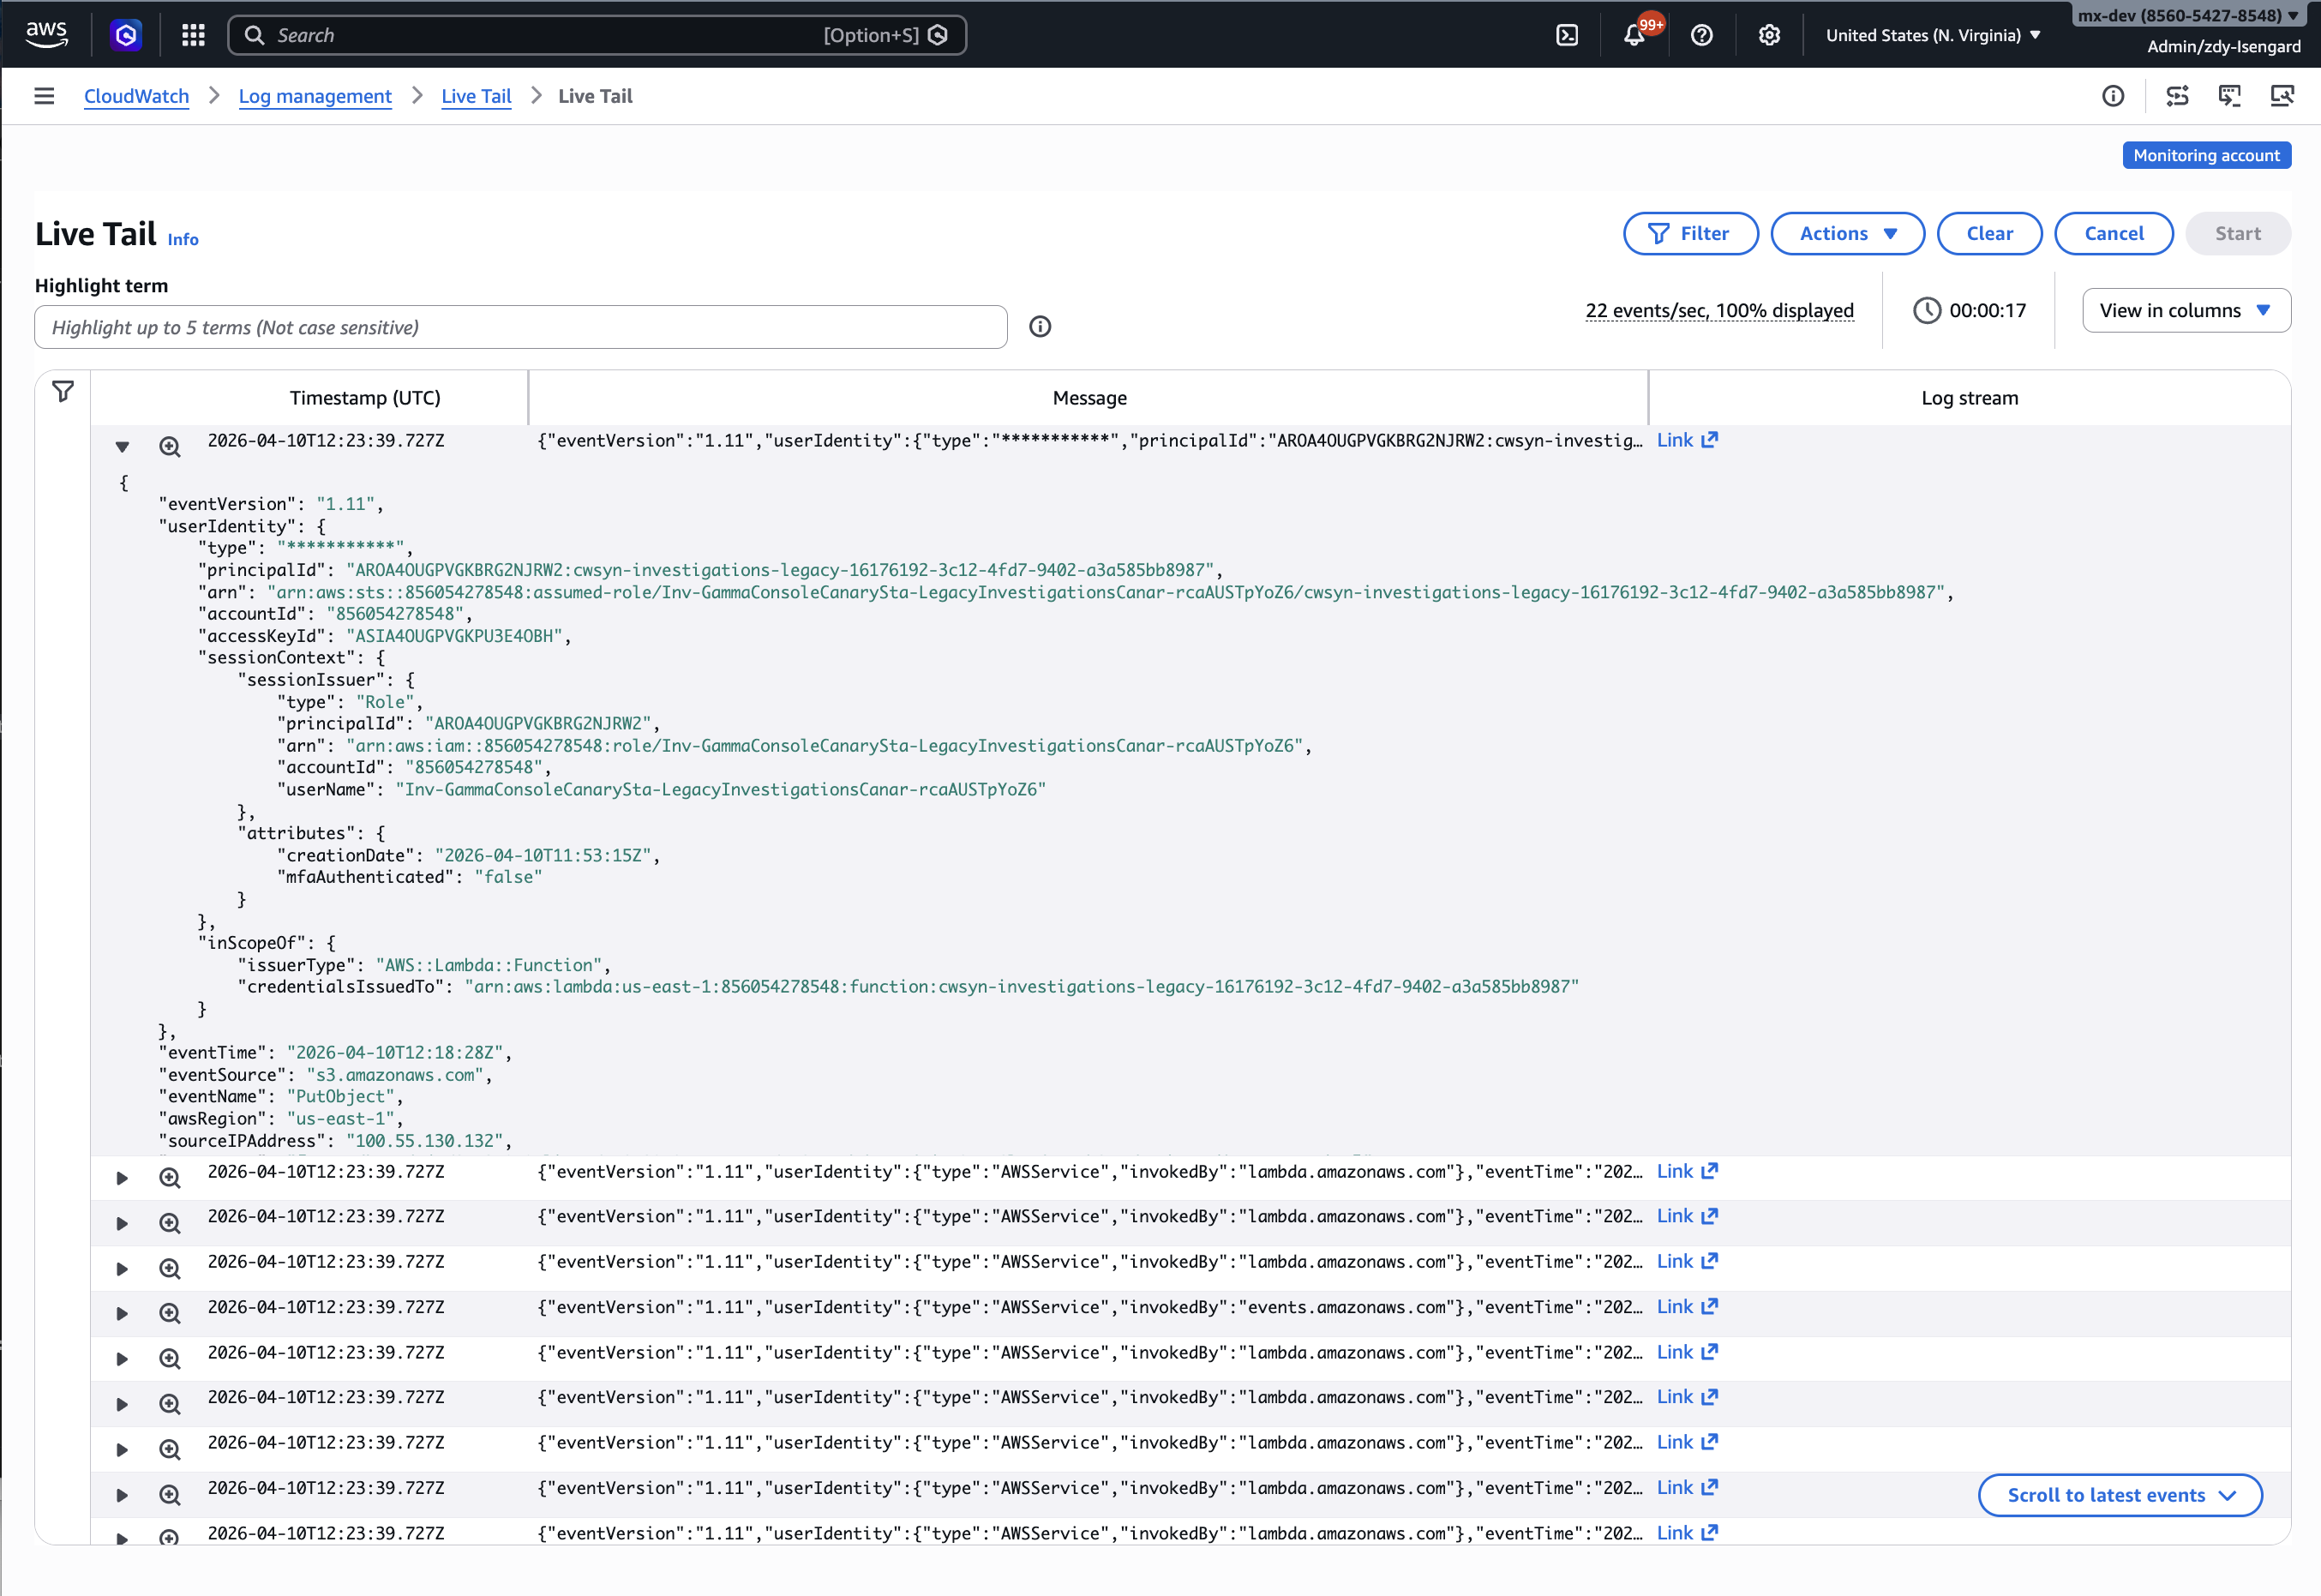
Event detail side panel with highlighting and trailing events navigation
Expanding on any event pauses the stream and opens up the row showing the full event data and related options. The critical interaction: clicking "Log stream" link will enable "View trailing events" via opening the Log stream in a new browser tab, showing the selected event with its surrounding context — leading and trailing events that reveal what happened before and after. A "Scroll to latest events" button appears at the bottom-right to instantly jump back to the live stream. This pause-inspect-resume pattern is what bridges real-time monitoring and deep investigation.
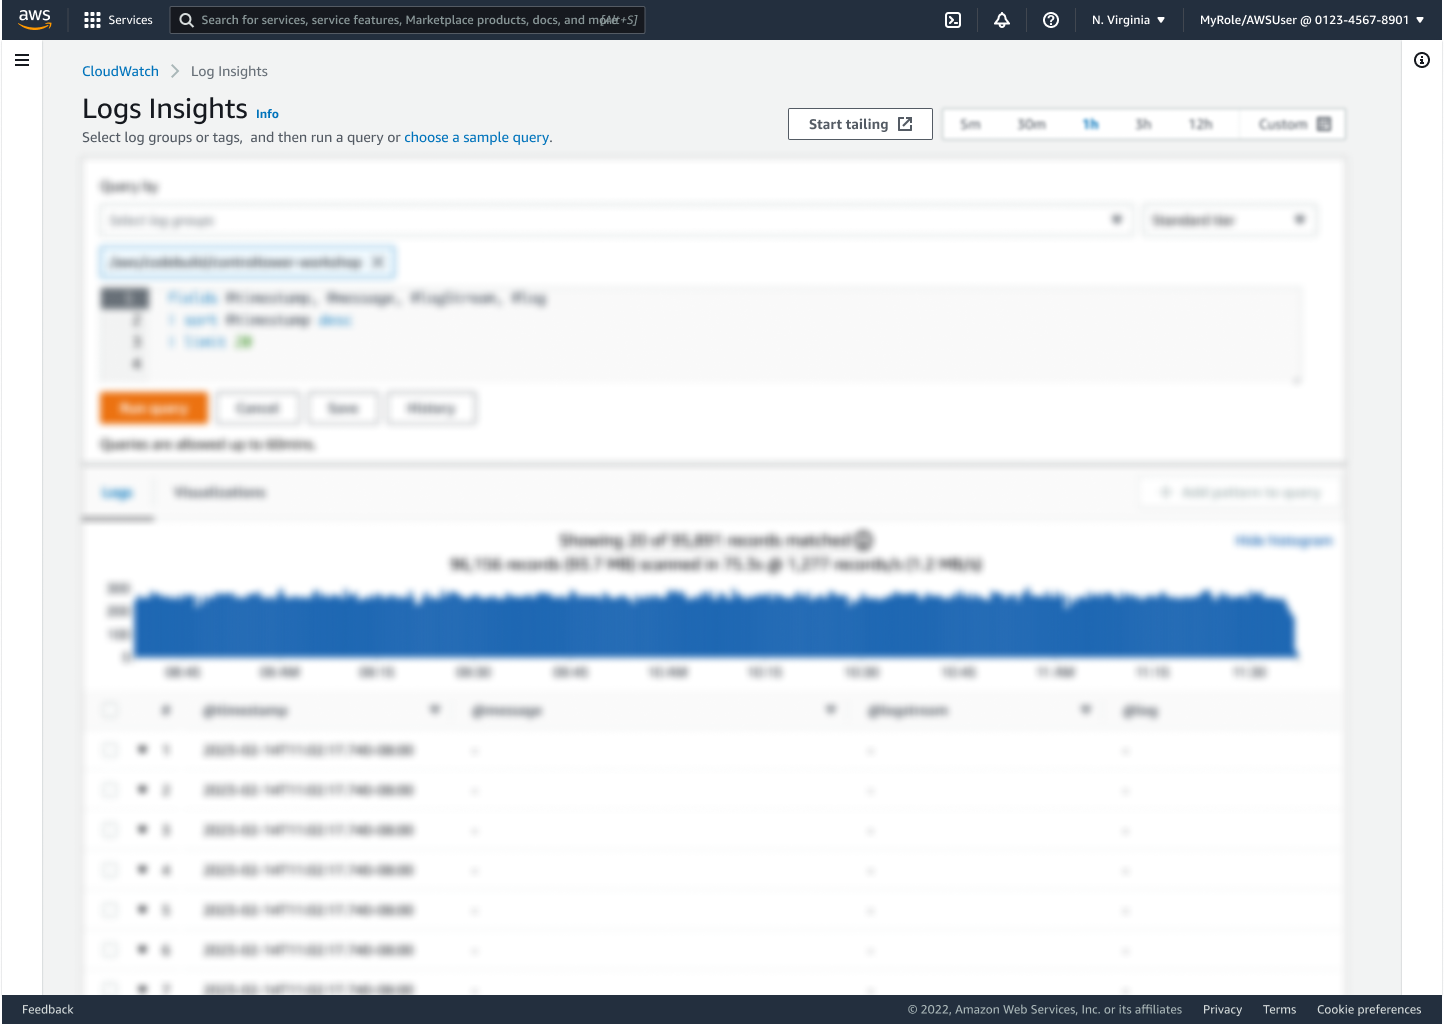
Live Tail can be started from three places: the dedicated Live Tail page under Logs, from the Log Groups console (select one or more groups and the "Start tailing" button appears), and from Logs Insights (same pattern). This wasn't just convenience — it was a principle: meet users where they already are. Developers who live in Log Groups shouldn't have to navigate to a separate page. The "Start tailing" button surfaces contextually when the right preconditions are met (log groups selected), keeping the entry point discoverable without cluttering the default interface. It's also natively integrated into the Lambda and ECS consoles for direct function and container debugging.
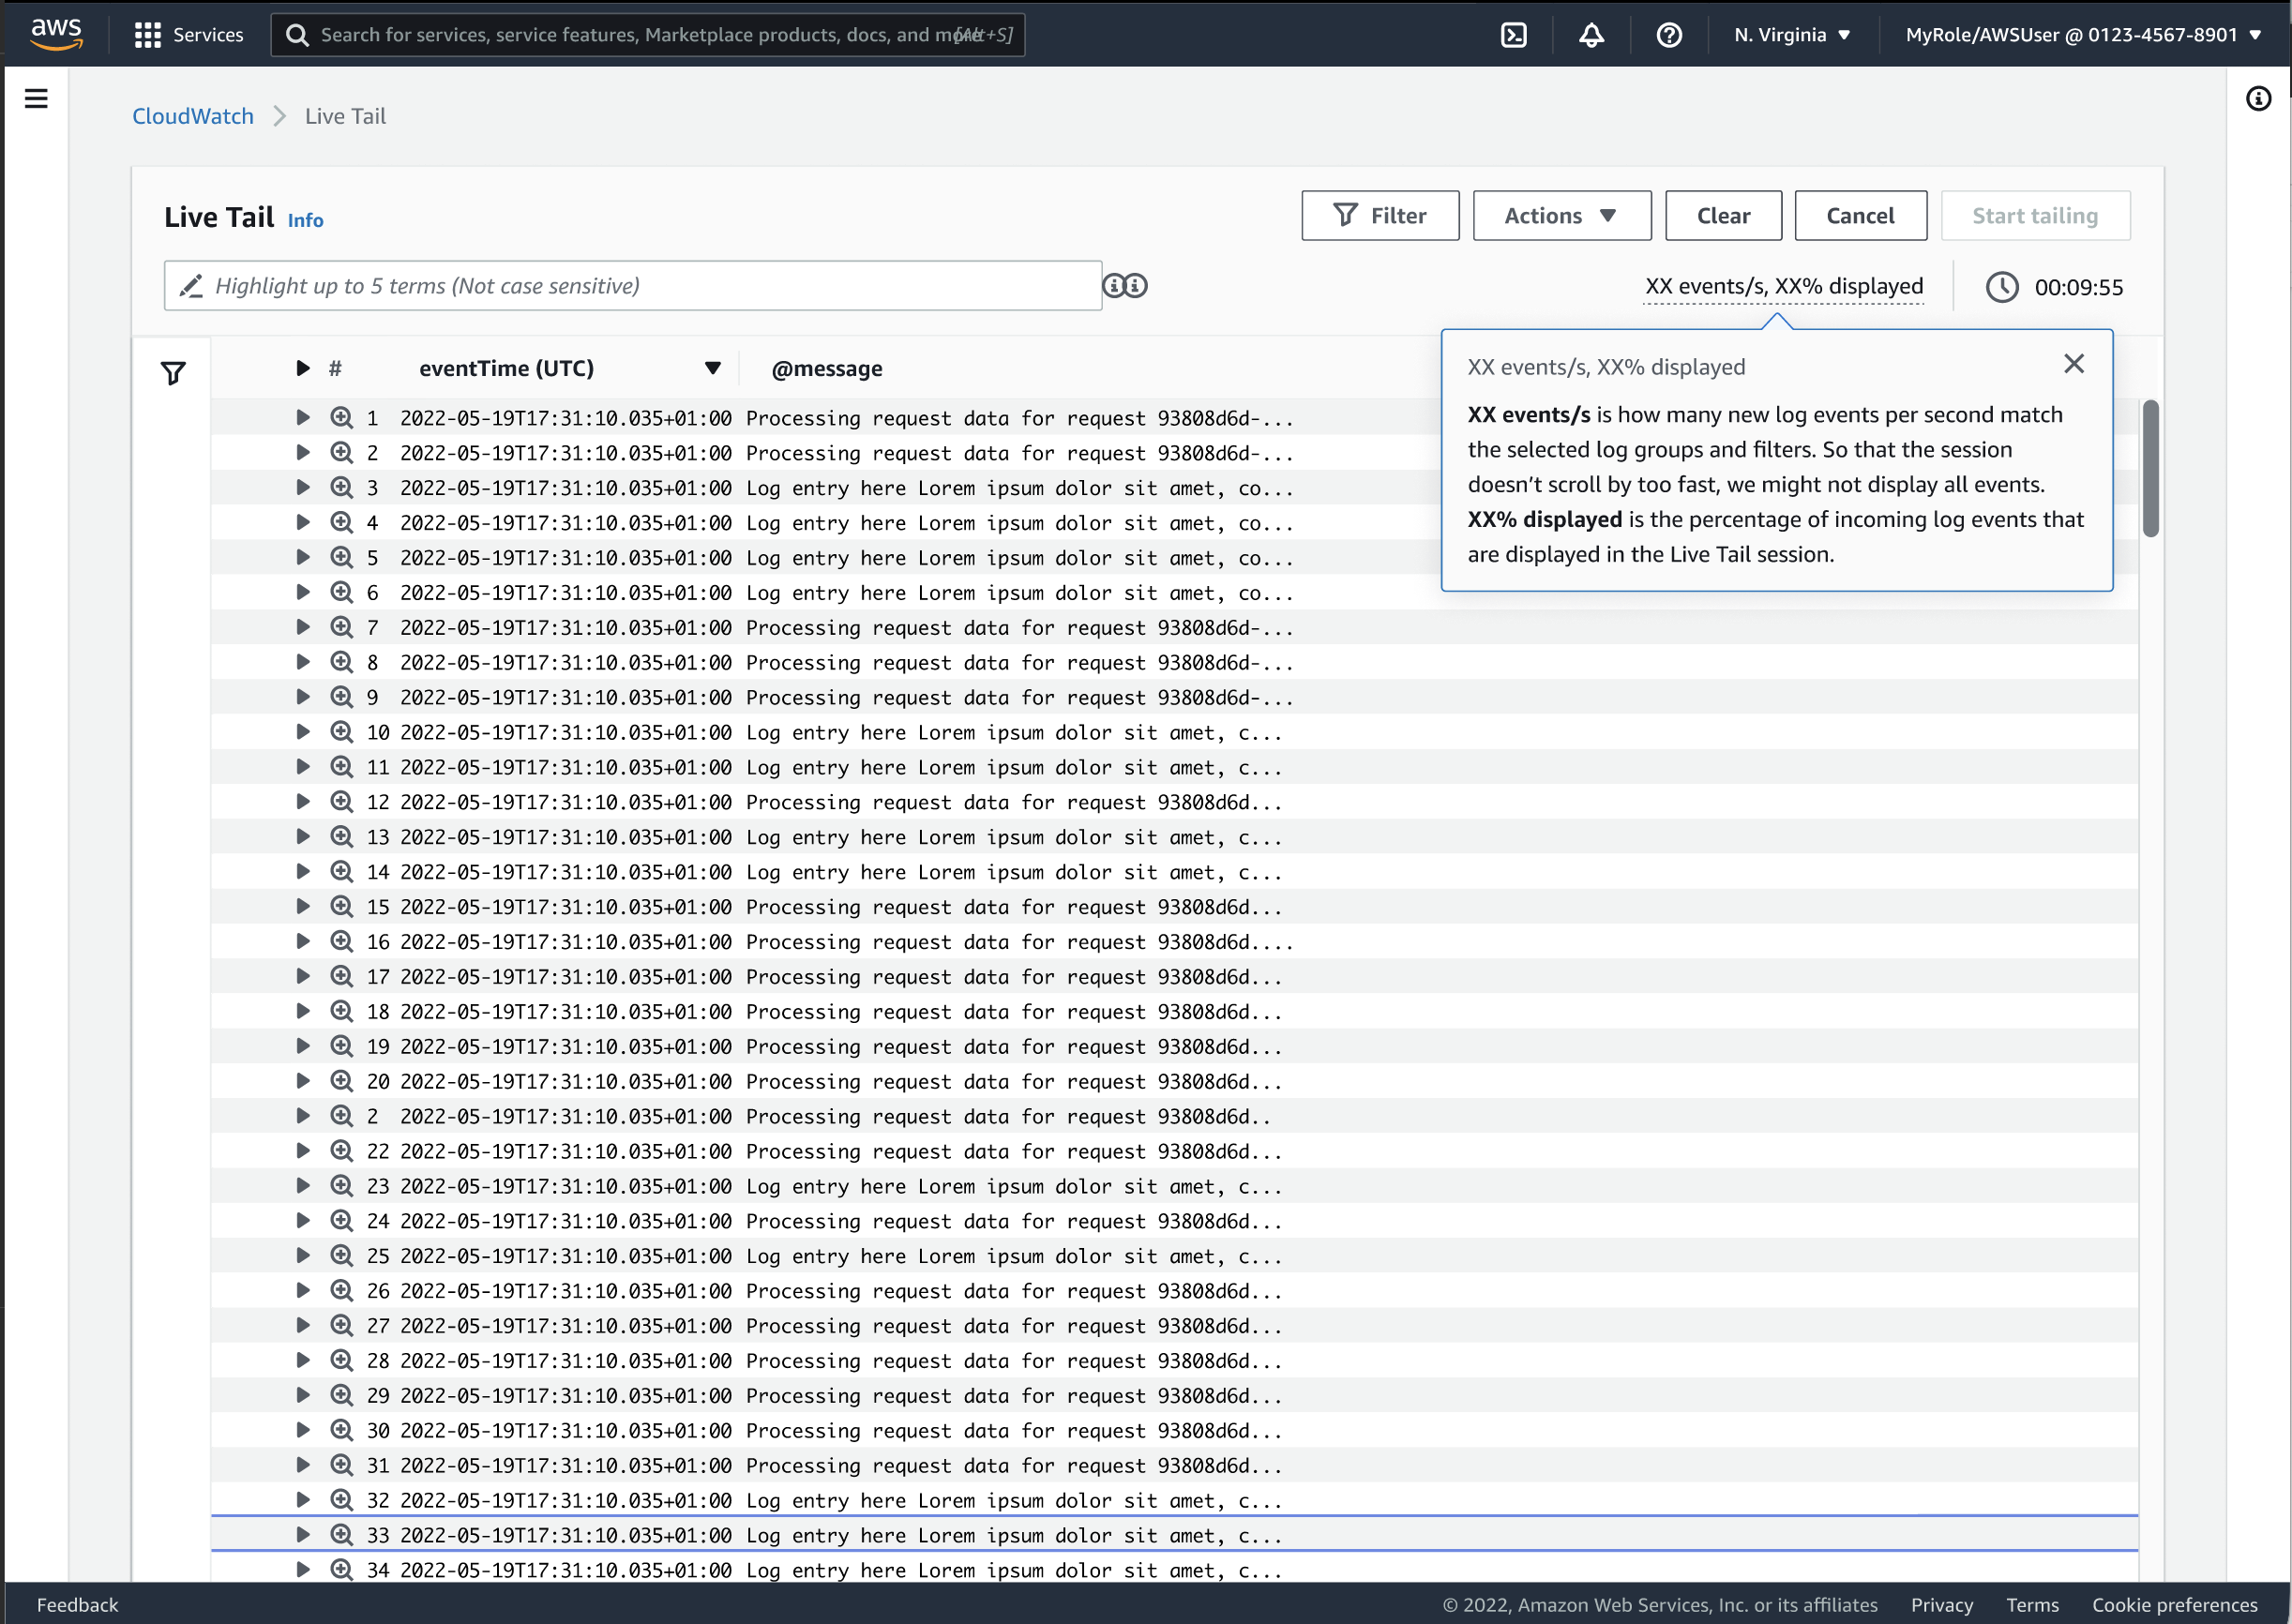
The top-right corner shows real-time stats: "xx events/s, % displayed" tells users exactly how many events are arriving and what percentage the console is rendering. A session timer tracks duration. When volume exceeds display capacity, the "% displayed" indicator drops — but events that aren't displayed continue their journey to be processed and stored in CloudWatch Logs. This transparency was a deliberate design choice: at 5+ petabytes of logs daily, hiding the constraint would erode trust during the exact moments (high-volume incidents) when trust matters most. Sessions auto-pause after inactivity to manage costs, with a clear "Restart this session" button to resume. Users can also toggle between plain text and JSON formatting, and clear the current view without ending the session.
Feature Demo
Technical Walkthrough
Three key takeaways from designing Live Tail that I carry into every project since:
Transparency builds trust in data-dense tools. The "% displayed" indicator was the most debated design decision — some stakeholders wanted to hide the constraint. But power users debugging production incidents need to know what they're seeing is honest, even if it's incomplete. Showing the constraint made the tool more trustworthy, not less. This principle now shapes how I approach every AI feature where the system's confidence isn't 100%.
Meet users where they are, not where you want them. Three entry points instead of one dedicated page was more engineering work, but it eliminated the context-switch that kills debugging flow. The Lambda and ECS console integrations proved this: adoption was highest from the consoles where developers already lived, not from the standalone page.
Design for both modes, not just one. Real-time monitoring and deep investigation feel like two different tools, but developers need them in the same flow. The pause-inspect-resume pattern bridged them. This "two modes, one surface" insight now influences every complex tool I design — it's the same tension between scanning and drilling down that exists in dashboards, listing tools, and admin consoles.